

Reports
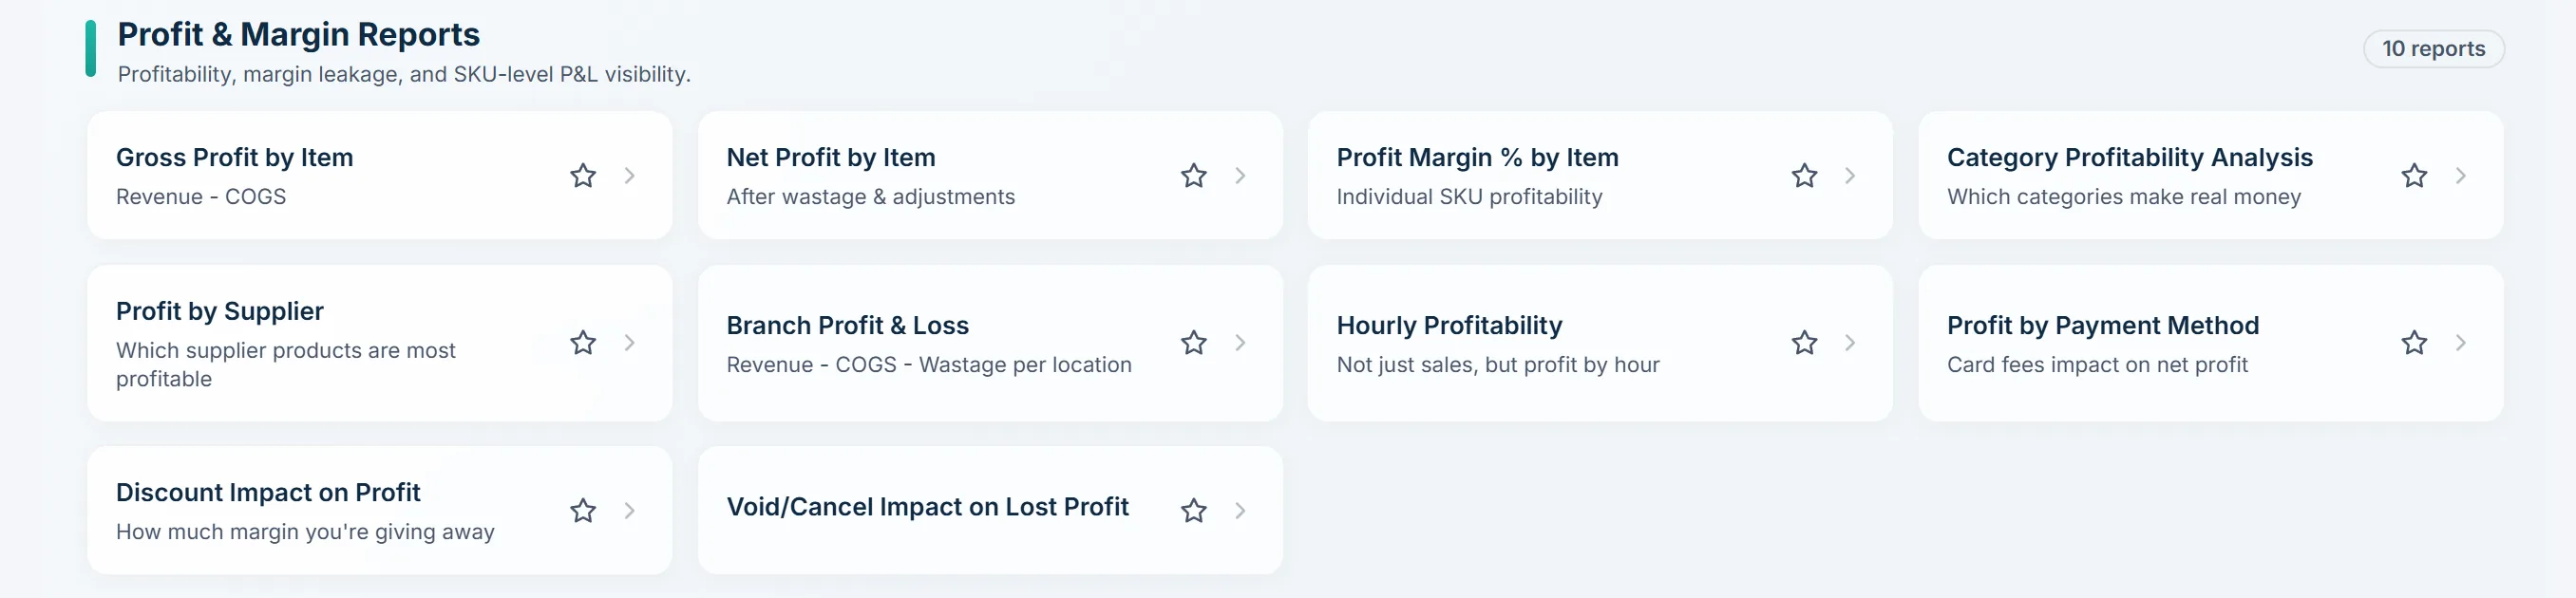
Which brand, which dish, which hour pays the rent
Cloud kitchens live on two peaks a day. TajerGo shows sales rhythm by hour, margin by brand and by dish, and a library of profit reports, all in rupees from the orders already keyed.
Step by step
How it works
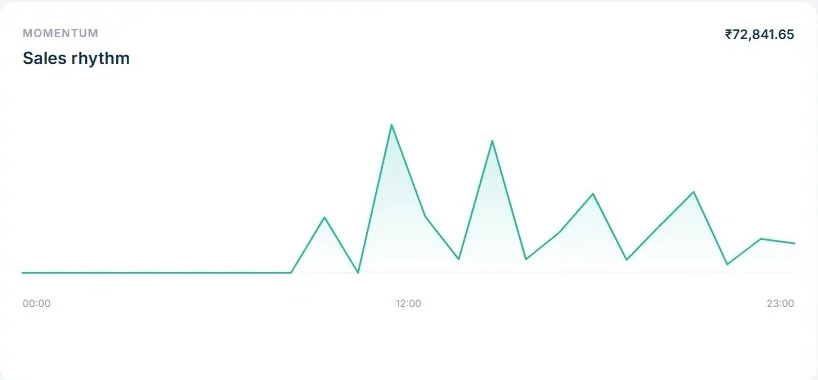
See the day by hour
Lunch and dinner peaks, and the dead hours between.
Demonstration data Split by brand
Each brand with its own sales and food cost.
Reports, Cloud kitchens Drop what does not earn
Dish-level margin shows what to cut from a brand menu.
Reports, Cloud kitchens
What you can do
Hourly profitability
Peaks and troughs by hour.
Per-brand margin
Brand P&L from shared stock.
ExportsGrowth plan
Exports and advanced analytics.
The connected loop
Connected to
Pricing
Plans and pricing
Frequently asked questions
Can I see margin by brand?
Yes, recipes attribute cost to the brand that sold each dish.
Read your kitchen by brand and by hour
Book a demo or start on the free plan.
Ask our team to call you
Leave your details and the TajerGo team will get back to you.