

Reports
See which seasons, designs and channels actually make money
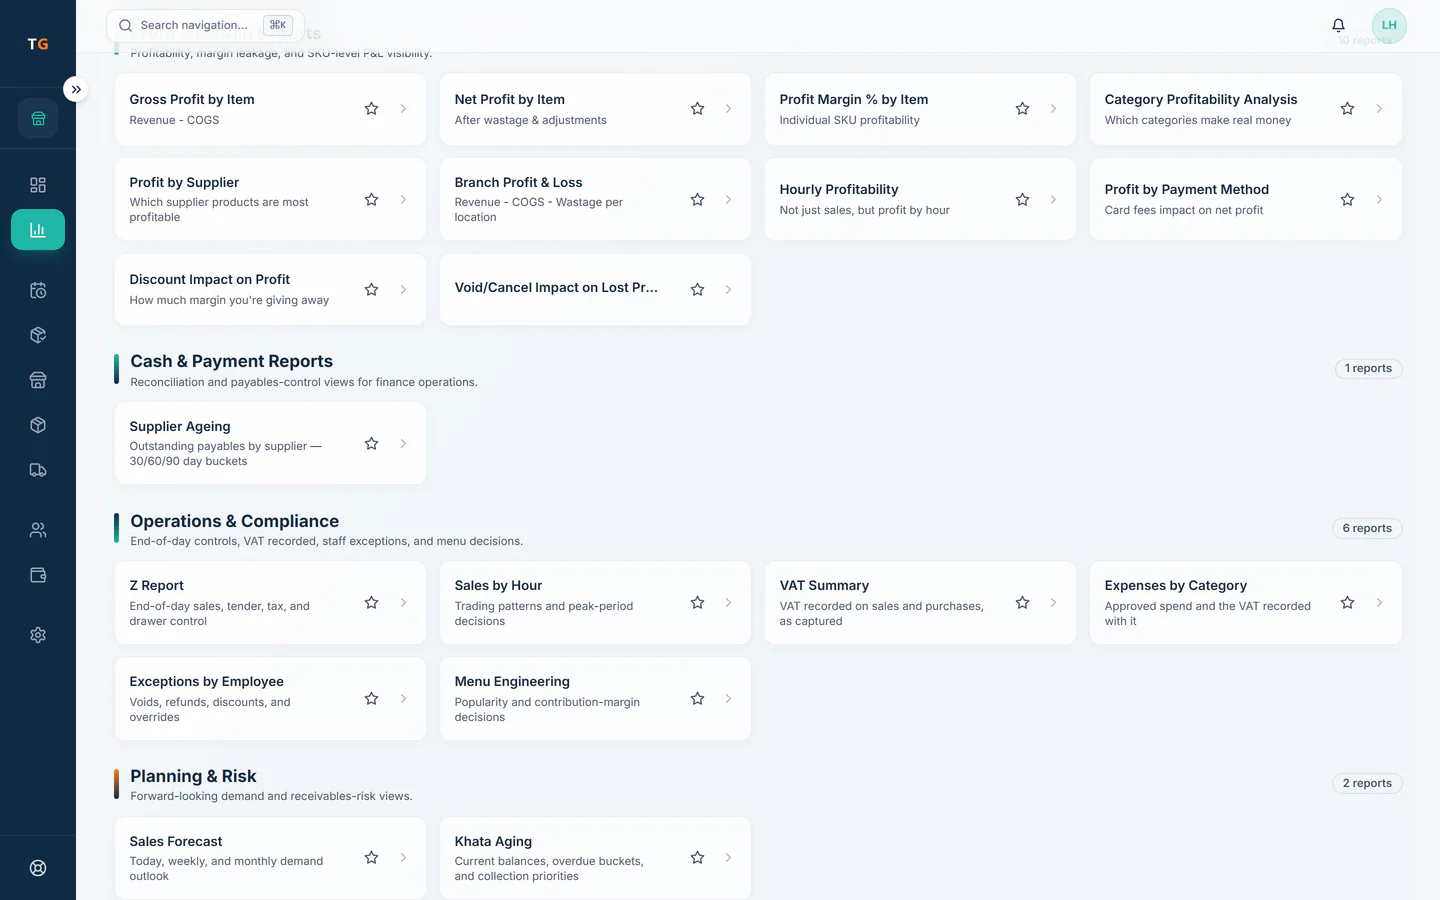
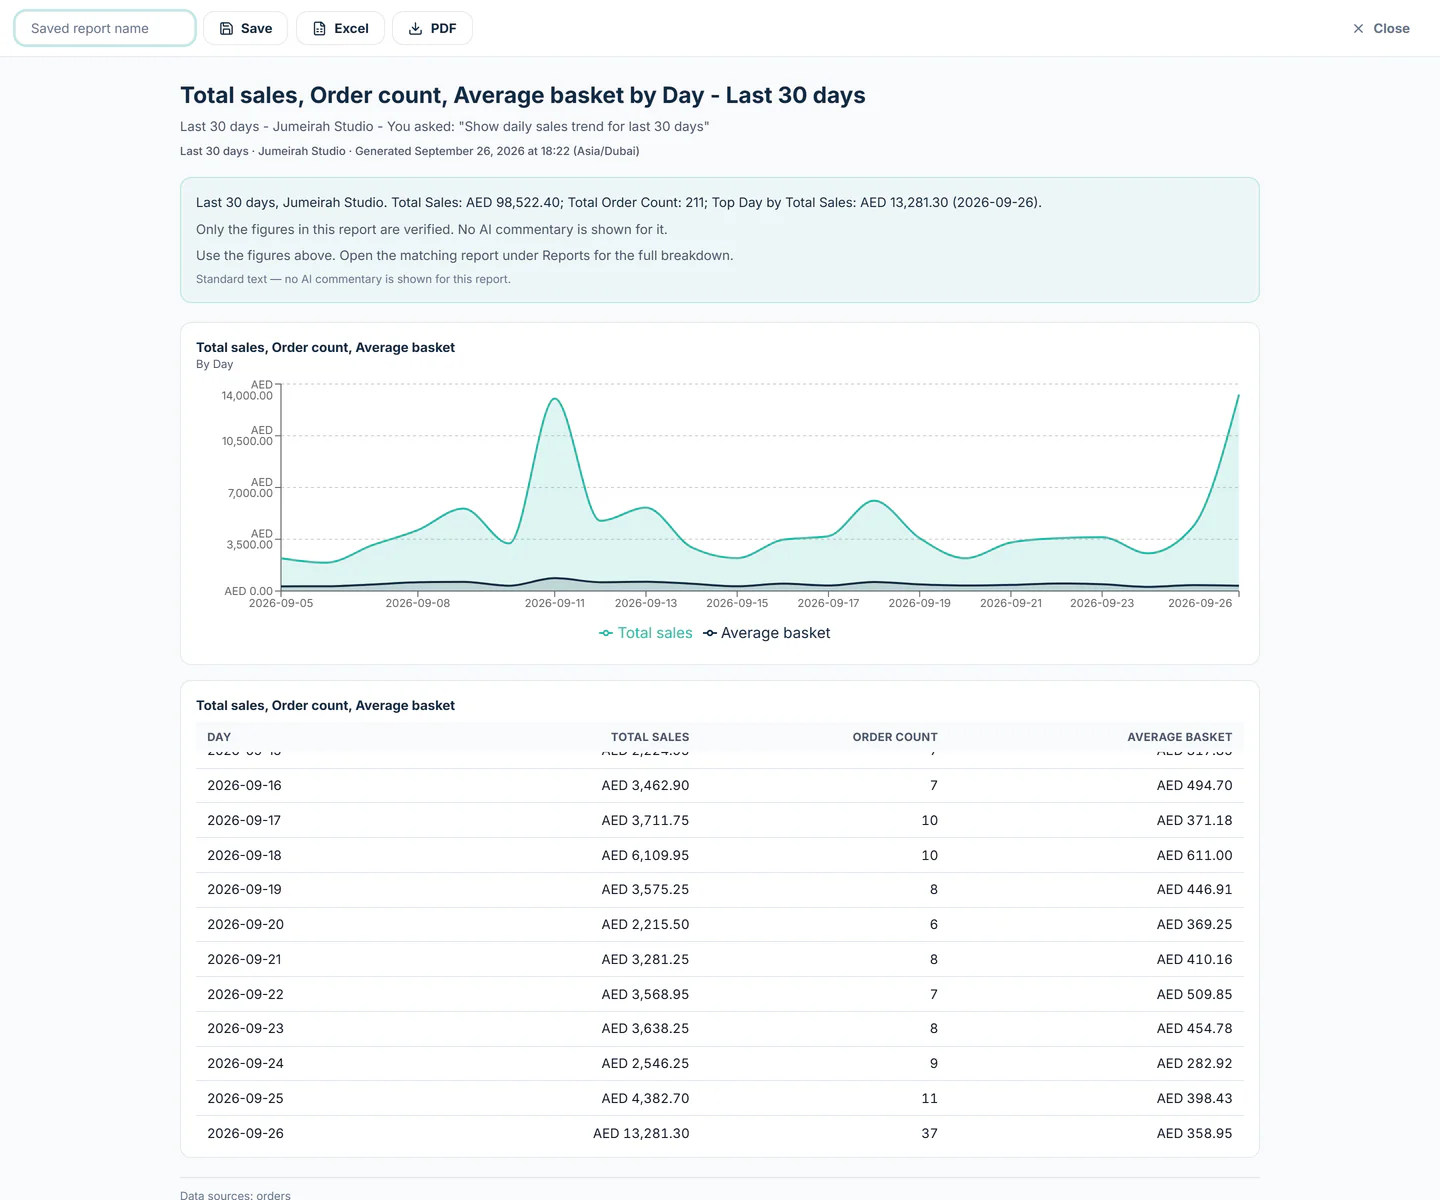
TajerGo reports show sales by day and period so you can compare one Valentine's week with the last, margin by bouquet design and chocolate box, and counter sales next to online shop orders. Wastage and stock value sit in the same library.
Step by step
How it works
Compare the big days
Pick the dates of a gifting season and compare them with the same period last year.
Seasons compared side by side. Find the designs that earn
Margin by product shows which bouquets and boxes pay for their stems and which only look busy.
Sales by occasion season, with counter and online shop side by side. Counter or online
Online shop orders carry their own channel, so you can see how much of the season came through the web.
Sales by occasion season, with counter and online shop side by side. Watch the waste
Wastage by item shows which flowers you keep over-ordering.
Wastage recorded against stock.
What you can do
Sales by period
Any date range, compared with an earlier one.
Margin by product
Bouquet designs and boxes ranked by what they earn.
Sales by channel
Counter and online shop orders side by side.
Wastage and stock value
What was written off and what is on the shelf.
Report builderScale plan
Build your own reports from allowed metrics.
The connected loop
Connected to
Inside the product
Pricing
Plans and pricing
From the help centre
See how the workflow actually works
Product documentation, not customer stories.
Frequently asked questions
Can I compare this Eid with last Eid?
Yes. Choose the two date ranges and compare sales and margin.
Do online orders show separately?
Yes. They are posted as online shop orders, so reports can split them from counter sales.
Can I export reports?
Exports come with advanced analytics on the Growth plan.
Plan the next season on last season's numbers
Book a demo or start on the free plan.
Ask our team to call you
Leave your details and the TajerGo team will get back to you.